What this post covers
This is the eighth post in the "Digging into Kafka's Source" series. Post 6 followed a producer's batch into the broker's log, and post 7 showed how that log sits on disk as segment files and indexes. Now we go the other way: the reading side. When a consumer calls poll(), a Fetch request goes out to the broker, and the broker finds the bytes on disk and sends them back. What happens in between is the subject of this post.
If you have used a consumer in an application, you have probably seen settings like fetch.min.bytes, fetch.max.wait.ms and max.partition.fetch.bytes, and heard that "Kafka is fast because of zero-copy". This post looks for those things in the source. It tries to answer four questions:
- Which classes does a consumer's Fetch pass through inside the broker before it reaches the bytes on disk? What is the same, and what is different, when a follower broker sends the Fetch?
- When there is not enough to read, how does the broker "wait, then answer"? What do the request-handler threads do while it waits?
- How does Kafka keep small the request that asks about the same partitions every few hundred ms (incremental fetch sessions)?
- Which line of the source is "zero-copy", and why does it go away when you turn on TLS?
| Item | Value |
|---|---|
| Project | Apache Kafka |
| Version | 4.5.0-SNAPSHOT (trunk) |
| Commit | ab1e816411 (2026-10-24) |
| Main classes | KafkaApis.handleFetchRequest(), ReplicaManager.fetchMessages()·readFromLog(), Partition.fetchRecords(), read() of UnifiedLog·LocalLog·LogSegment, DelayedFetch·DelayedOperationPurgatory, FetchManager·FetchSession, FileRecords.writeTo(), PlaintextTransportLayer·SslTransportLayer |
All line numbers in this post refer to this commit. Post 1 shows how to check out the same commit and build the Docker image used for the examples.
On the map from post 2, this post goes down from zone C (request handling) through zone D (partitions) to zone E (log storage), and then back up to zone B (the network layer). Post 6 went down the same zones in the write direction; this time we go down and back up in the read direction. The picture below shows the parts we will meet.
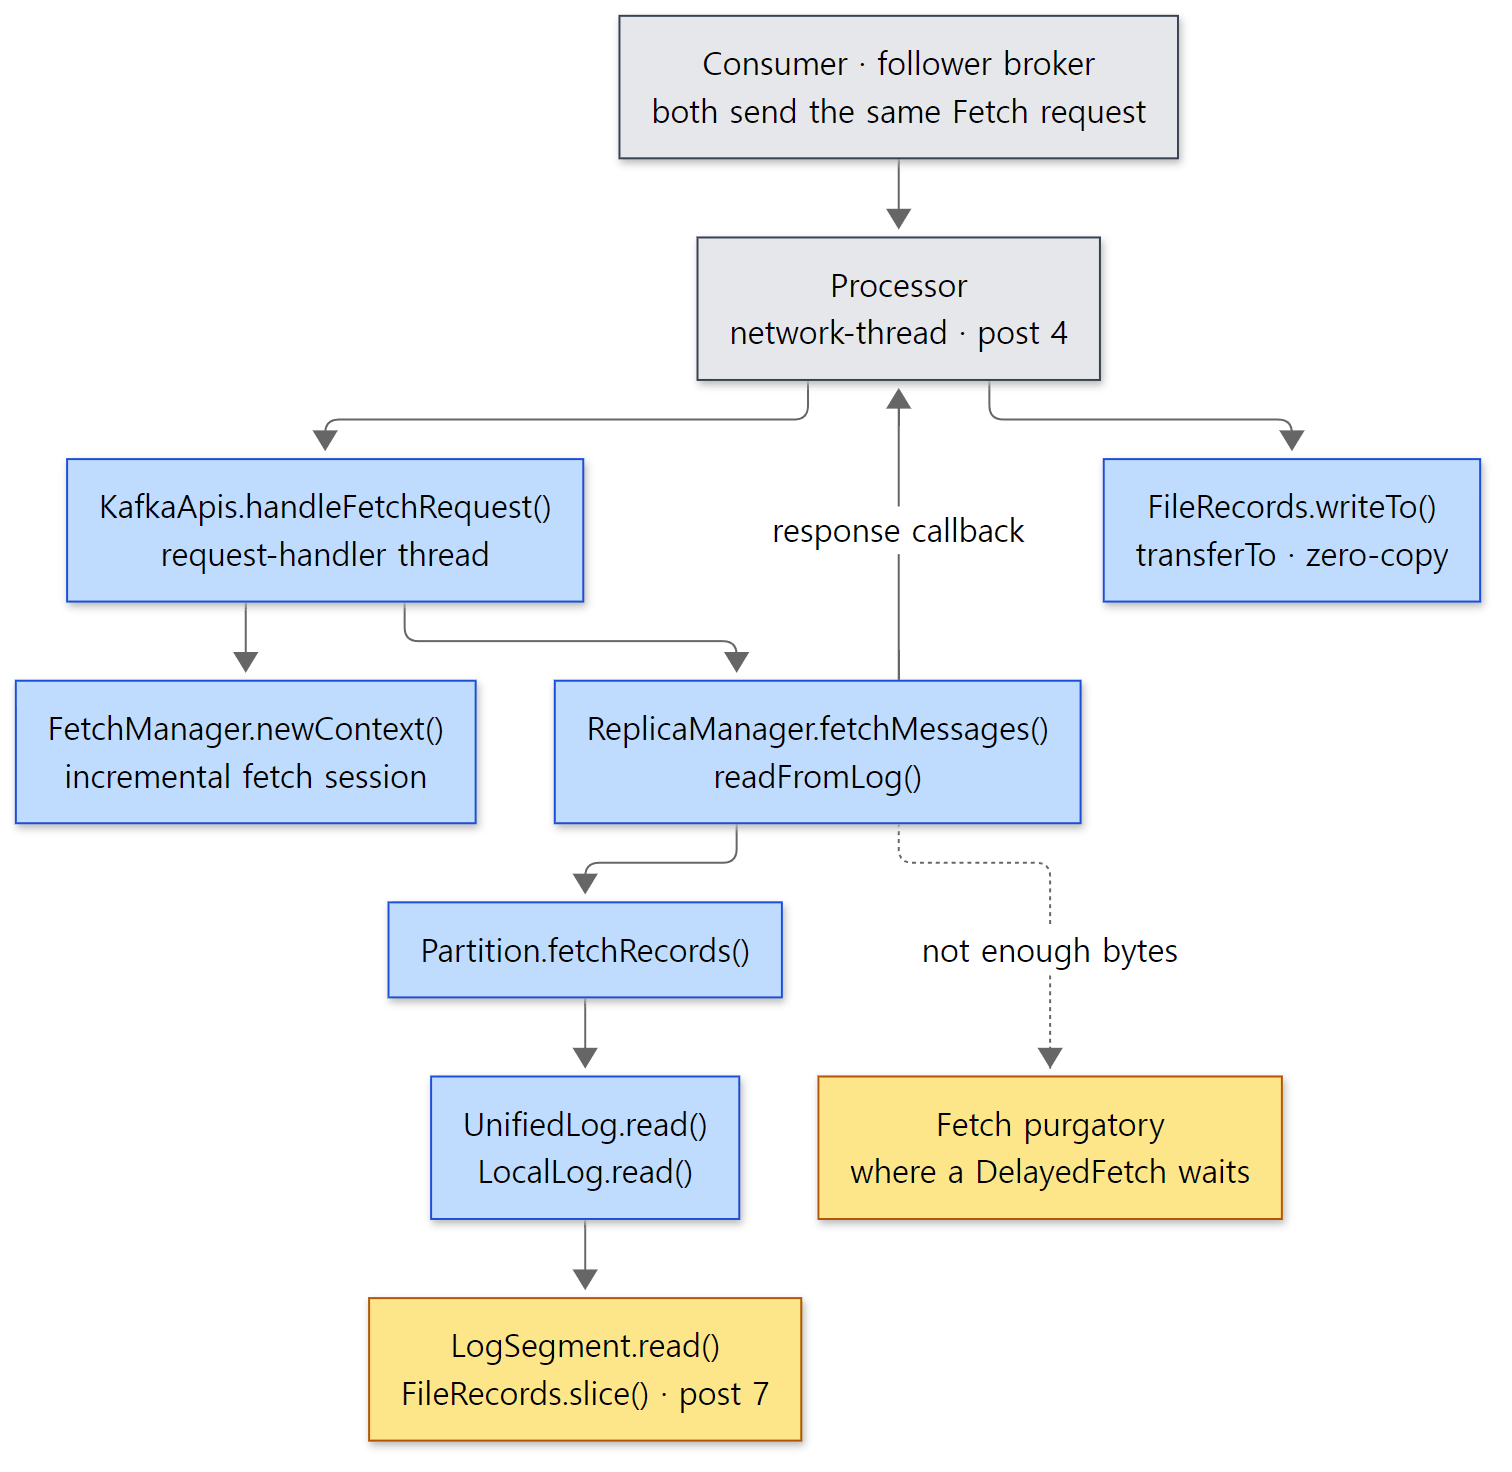 Blue boxes are methods we read in this post, yellow boxes are where data stays (the purgatory, segment files), and grey boxes are parts we met in earlier posts.
KafkaApis.scala is 4,404 lines long and ReplicaManager.scala is 2,577. The read path is tangled up with tiered storage, reading from a nearby replica (rack-aware fetch), quotas and transactions. This post picks only the main path a newcomer can follow; what it leaves out is listed by name and location in "What this post leaves out" at the end.
Words to know first
A Fetch request says "give me data from this offset of this partition". Its API key is 1, and the byte layout of the request and response is generated from JSON schemas (FetchRequest.json, FetchResponse.json) — see post 3. It is not just for consumers: a follower broker sends the same Fetch when it copies data from the leader. This post looks at the broker-side handling the two share, and leaves the follower's story to post 9.
Long polling means "if you ask and there is nothing to give, I won't send you away empty-handed right away; I'll wait a bit and answer as soon as something arrives". It stops consumers from receiving an empty response and asking again in a tight loop. In Kafka, MinBytes (the consumer setting fetch.min.bytes) and MaxWaitMs (fetch.max.wait.ms) in the request decide "how much must pile up before answering" and "the longest to wait".
The purgatory is a waiting room where requests that cannot finish right away sit until their condition is met. Post 6 only mentioned the name, saying that an acks=all Produce waits there. Section 4 of this post looks at its structure through Fetch. It is not a request-handler thread that waits, but a task object (DelayedFetch) that says "send the response once the condition is met".
HW, LEO, LSO: the LEO (log end offset) is the offset the next record will get — "the end of the log". The HW (high watermark) is the point up to which every member of the ISR (the replicas that keep up with the leader) has a copy; an ordinary consumer can read only up to just before the HW. How the HW moves is covered in post 9. The LSO (last stable offset) is the first offset of the earliest transaction that has not finished yet (the HW, if there is no such transaction or it lies beyond the HW; UnifiedLog.java lines 678–686); a consumer with isolation.level=read_committed reads only up to just before it (post 12).
A fetch session: a consumer asks about the same list of partitions every few hundred ms. Instead of sending and receiving the whole list every time, the broker remembers the list from the first request (the session) and from then on only changed partitions go back and forth. Section 5 covers it.
The page cache and zero-copy: the operating system keeps file contents it has read from disk in memory (the page cache). Normally, to send a file to a socket, a program reads the file into its own memory (read) and then writes it to the socket (write). Zero-copy removes this "copy through the program's memory" and tells the operating system "send this range of this file to that socket". In Java, FileChannel.transferTo() is the door.
FileRecords: an object that points at one segment file (.log), or at a range of it (post 7). In this post it travels in the response all the way to the socket as "the location of bytes not read yet".
1. One Fetch request — consumers and followers use the same one
First, what goes into the request. These are the request-level fields of FetchRequest.json.
    { "name": "ReplicaId", "type": "int32", "versions": "0-14", "default": "-1", "entityType": "brokerId",
      "about": "The broker ID of the follower, of -1 if this request is from a consumer." },
    // ... (from version 15, moved into ReplicaId·ReplicaEpoch inside the tagged field ReplicaState) ...
    { "name": "MaxWaitMs", "type": "int32", "versions": "0+",
      "about": "The maximum time in milliseconds to wait for the response." },
    { "name": "MinBytes", "type": "int32", "versions": "0+",
      "about": "The minimum bytes to accumulate in the response." },
    { "name": "MaxBytes", "type": "int32", "versions": "3+", "default": "0x7fffffff", "ignorable": true,
      "about": "The maximum bytes to fetch.  See KIP-74 for cases where this limit may not be honored." },
    // ... (IsolationLevel — 1 for read_committed) ...
    { "name": "SessionId", "type": "int32", "versions": "7+", "default": "0", "ignorable": true,
      "about": "The fetch session ID." },
    { "name": "SessionEpoch", "type": "int32", "versions": "7+", "default": "-1", "ignorable": true,
      "about": "The fetch session epoch, which is used for ordering requests in a session." },
clients/src/main/resources/common/message/FetchRequest.json lines 71–91, abridged
Below these, each topic and partition gets fields like FetchOffset (start here), PartitionMaxBytes (at most this many bytes from this partition) and CurrentLeaderEpoch (lines 97–110). One request asks about many partitions at once.
The first field to look at is ReplicaId. A consumer writes -1, a follower writes its own broker id (from version 15 it moved into the tagged field ReplicaState; tagged fields were covered in post 3). That one value tells the broker who sent the request.
Where consumer settings become request fields
On the consumer side, the request is built in AbstractFetch.createFetchRequest().
        final FetchRequest.Builder request = FetchRequest.Builder
                .forConsumer(maxVersion, fetchConfig.maxWaitMs, fetchConfig.minBytes, requestData.toSend())
                .isolationLevel(fetchConfig.isolationLevel)
                .setMaxBytes(fetchConfig.maxBytes)
                .metadata(requestData.metadata())
                .removed(requestData.toForget())
                .replaced(requestData.toReplace())
                .rackId(fetchConfig.clientRackId);
clients/src/main/java/org/apache/kafka/clients/consumer/internals/AbstractFetch.java lines 313–320
fetchConfig.maxWaitMs, minBytes and maxBytes hold the values of fetch.max.wait.ms, fetch.min.bytes and fetch.max.bytes, and forConsumer() puts CONSUMER_REPLICA_ID (-1) into ReplicaId (FetchRequest.java line 41, line 167). What metadata(...) carries is the session id and epoch of section 5. I checked the defaults in the define(...) calls of ConsumerConfig.
| Consumer setting | Constant | Default | Request field |
|---|---|---|---|
fetch.min.bytes |
DEFAULT_FETCH_MIN_BYTES |
1 | MinBytes |
fetch.max.wait.ms |
DEFAULT_FETCH_MAX_WAIT_MS |
500 | MaxWaitMs |
fetch.max.bytes |
DEFAULT_FETCH_MAX_BYTES |
50 MiB | MaxBytes |
max.partition.fetch.bytes |
DEFAULT_MAX_PARTITION_FETCH_BYTES |
1 MiB | PartitionMaxBytes per partition |
Constants at ConsumerConfig.java lines 212, 225, 235, 250; define(...) at lines 510–545
A follower builds the same request in RemoteLeaderEndPoint with FetchRequest.Builder.forReplica(version, brokerConfig.brokerId, brokerEpochSupplier(), maxWait, minBytes, fetchData.toSend) (RemoteLeaderEndPoint.scala lines 212–217). Its maxWait and minBytes are the broker settings replica.fetch.wait.max.ms (default 500) and replica.fetch.min.bytes (default 1) (ReplicationConfigs.java lines 75 and 80). Different names, same long-polling knobs as the consumer's.
Who sent it decides "how far may I read"
The broker looks at ReplicaId and picks how far a read may go.
    public static FetchIsolation of(int replicaId, IsolationLevel isolationLevel) {
        if (!FetchRequest.isConsumer(replicaId)) {
            return LOG_END;
        } else if (isolationLevel == IsolationLevel.READ_COMMITTED) {
            return TXN_COMMITTED;
        } else {
            return HIGH_WATERMARK;
        }
    }
server-common/src/main/java/org/apache/kafka/server/storage/log/FetchIsolation.java lines 31–39
isConsumer() is replicaId < 0 && replicaId != FUTURE_LOCAL_REPLICA_ID (FetchRequest.java lines 463–465). So there are three cases.
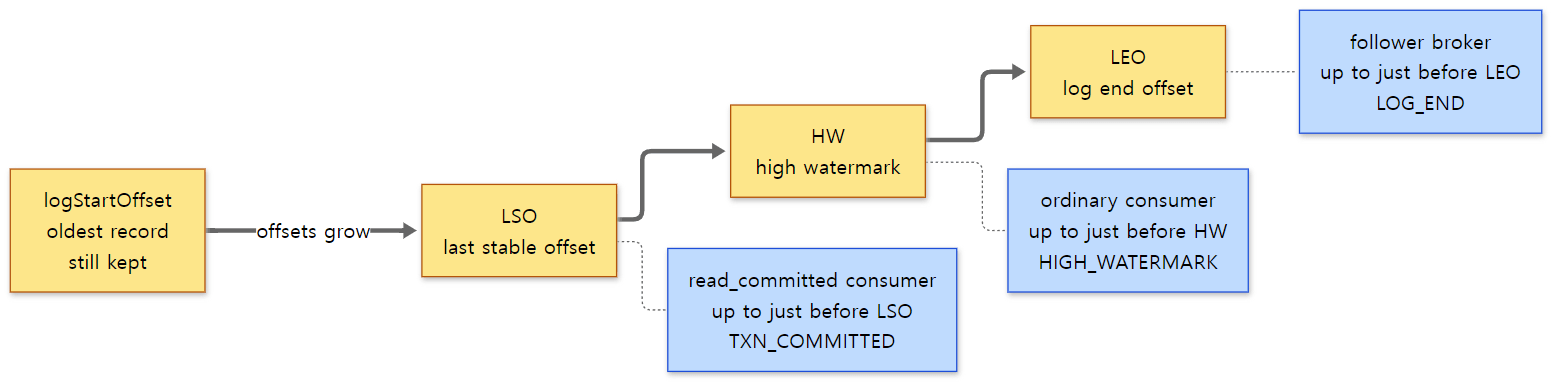 The same Fetch can read to a different end depending on who sent it. In section 3 this choice becomes "up to which position in the file to cut".
A follower has to take records that are not committed yet, or replication would never progress, so it reads to the end of the log (LEO). A consumer reads only up to just before the HW, which every ISR member already has. If a consumer read past the HW, it could see records that disappear when the leader changes.
Easy to get wrong: there are two settings named fetch.max.bytes
Besides the consumer setting fetch.max.bytes (default 50 MiB) there is a broker setting with the same name, whose default is 55 MiB (ServerConfigs.java lines 114–115). The broker uses the smaller of the two (line 748 of KafkaApis, section 2). If you raise the consumer's fetch.max.bytes to 100 MiB but leave the broker setting alone, a response still won't exceed 55 MiB.
2. The path inside the broker — from handleFetchRequest() to fetchMessages()
When a Fetch request reaches the broker, a Processor (network thread) reads the bytes and puts the request on the request queue, as we saw in post 4; a request-handler thread takes it and goes to case ApiKeys.FETCH => handleFetchRequest(request) in KafkaApis.handle() (line 176). From there until the response leaves through the socket, it looks like this.
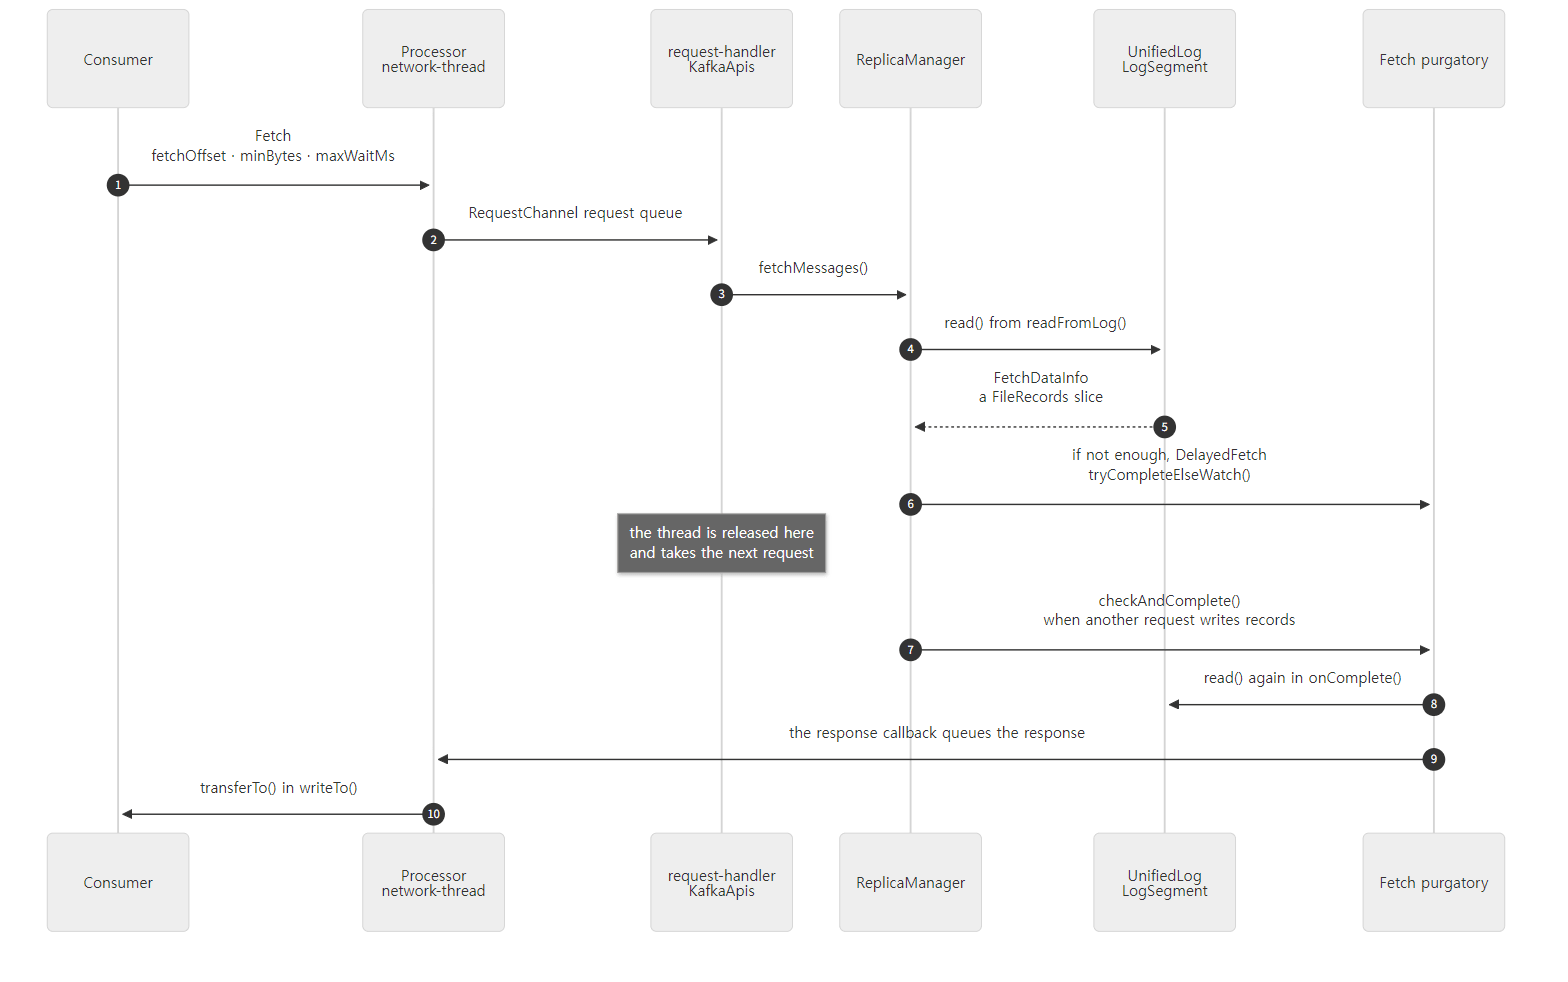 If there is enough data from the start, steps 6–8 are skipped and step 5 goes straight to step 9. The numbers match the text below.
handleFetchRequest(): resolve the session, check permissions, set the limits
handleFetchRequest() first gets "the list of partitions to read this time" from the fetch session of section 5 (fetchManager.newContext(...), lines 581–587). Next it checks cluster permission for a follower, or READ permission per topic for a consumer, and splits the partitions into interesting (to read) and erroneous (to answer with an error) (lines 591–625). Then it hands the read to ReplicaManager.
      val fetchMaxBytes = Math.min(Math.min(fetchRequest.maxBytes, config.fetchMaxBytes), maxQuotaWindowBytes)
      val fetchMinBytes = Math.min(fetchRequest.minBytes, fetchMaxBytes)

      // ... (clientMetadata from version 11 — for reading from a nearby replica) ...

      val params = new FetchParams(
        fetchRequest.replicaId,
        fetchRequest.replicaEpoch,
        fetchRequest.maxWait,
        fetchMinBytes,
        fetchMaxBytes,
        FetchIsolation.of(fetchRequest),
        clientMetadata
      )

      // call the replica manager to fetch messages from the local replica
      replicaManager.fetchMessages(
        params = params,
        fetchInfos = interesting,
        quota = replicationQuota(fetchRequest),
        responseCallback = processResponseCallback,
      )
core/src/main/scala/kafka/server/KafkaApis.scala lines 748–779, abridged
Reading Scala —
valis a variable you cannot reassign (like a Javafinallocal). Passingname = value, as infetchMessages(params = params, ...), is a named argument: the value goes to the parameter with that name, regardless of order.
Look at the last argument, responseCallback = processResponseCallback. processResponseCallback is a function defined inside the same method (lines 640–735); it takes the read results, builds the response (FetchResponse) and sends it with requestChannel.sendResponse(). fetchMessages() returns nothing; it calls this callback instead. It may call it right now, or a few seconds later on another thread. Long polling grows out of this shape.
fetchMessages(): read once, and wait if it is not enough
  def fetchMessages(params: FetchParams,
                    fetchInfos: Seq[(TopicIdPartition, PartitionData)],
                    quota: ReplicaQuota,
                    responseCallback: Seq[(TopicIdPartition, FetchPartitionData)] => Unit): Unit = {

    // check if this fetch request can be satisfied right away
    val logReadResults = readFromLog(params, fetchInfos, quota, readFromPurgatory = false)
    var bytesReadable: Long = 0
    var errorReadingData = false
    // ... (variables that flag remote storage, diverging epochs, preferred replicas) ...

    logReadResults.foreach { case (topicIdPartition, logReadResult) =>
      // ... (update metrics, flag errors · remote storage · diverging epochs) ...
      bytesReadable = bytesReadable + logReadResult.info.records.sizeInBytes
      // ...
    }

    // Respond immediately if no remote fetches are required and any of the below conditions is true
    //                        1) fetch request does not want to wait
    //                        2) fetch request does not require any data
    //                        3) has enough data to respond
    //                        4) some error happens while reading data
    //                        5) we found a diverging epoch
    //                        6) has a preferred read replica
    if (remoteFetchInfos.isEmpty && (params.maxWaitMs <= 0 || fetchInfos.isEmpty || bytesReadable >= params.minBytes || errorReadingData ||
      hasDivergingEpoch || hasPreferredReadReplica)) {
      val fetchPartitionData = logReadResults.map { case (tp, result) =>
        val isReassignmentFetch = params.isFromFollower && isAddingReplica(tp.topicPartition, params.replicaId)
        tp -> result.toFetchPartitionData(isReassignmentFetch)
      }
      responseCallback(fetchPartitionData)
    } else {
core/src/main/scala/kafka/server/ReplicaManager.scala lines 1665–1712, abridged
Reading Scala —
def f(...): Unitis a method with no return value (Java'svoid).responseCallback: Seq[...] => Unitis the type "a function that takes aSeqand returns nothing".varis a variable you can reassign.foreach { case (a, b) => ... }loops over pairs (tuples), unpacking each intoaandb.tp -> resultbuilds the pair(tp, result).
The order is the long-polling rule itself, steps 3–5 in the picture:
- Read once first (
readFromLog(..., readFromPurgatory = false)). Whether to wait is decided after reading. - Add up the bytes read into
bytesReadable. - If any of the six conditions in the comment holds, call the callback right away. With the default
fetch.min.bytes=1, a single byte read makes 3) true, so it answers immediately. - Otherwise go to
else, create aDelayedFetchand put it in the purgatory (section 4, lines 1728–1745).
Note condition 1 as well: with maxWaitMs <= 0 it never waits. Set fetch.max.wait.ms=0 and long polling is off; when there is no data you get an empty response immediately.
readFromLog(): read each partition, spending one shared limit from the front
readFromLog() calls an inner function read() for each partition. The key part is the loop at the end.
    var limitBytes = params.maxBytes
    val result = new mutable.ArrayBuffer[(TopicIdPartition, LogReadResult)]
    var minOneMessage = true
    readPartitionInfo.foreach { case (tp, fetchInfo) =>
      val readResult = read(tp, fetchInfo, limitBytes, minOneMessage)
      val recordBatchSize = readResult.info.records.sizeInBytes
      // ... (estimatedRecordBatchSize: fetchMaxBytes as an estimate for a partition read from remote storage, else recordBatchSize) ...
      // Once we read from a non-empty partition, we stop ignoring request and partition level size limits
      if (estimatedRecordBatchSize > 0)
        minOneMessage = false
      limitBytes = math.max(0, limitBytes - estimatedRecordBatchSize)
      result += (tp -> readResult)
    }
    result
core/src/main/scala/kafka/server/ReplicaManager.scala lines 1894–1910, abridged
Reading Scala —
mutable.ArrayBufferis a growable list like Java'sArrayList, andresult += (tp -> readResult)appends one pair to it. In Scala the last expression of a block is its value, so the final lineresultmeansreturn result.
limitBytes starts at the limit for the whole request (the smaller of fetch.max.bytes and the broker setting) and shrinks by what each partition read. Each partition reads at most min(PartitionMaxBytes, limitBytes) (adjustedMaxBytes inside read(), line 1796). So partitions listed earlier in the request get to spend the limit first.
minOneMessage is a flag meaning "the first partition that yields data gets its whole first batch, even if that exceeds the limit". It travels all the way down to LogSegment.read() (section 3) so that a first batch larger than max.partition.fetch.bytes is not cut. Otherwise, a single batch bigger than 1 MiB at the front of a partition would never be delivered, and the consumer would keep asking for the same offset forever. Once any data comes out, minOneMessage = false, and the following partitions respect the limit.
Easy to get wrong: missing fetch.min.bytes does not mean "you get nothing"
With a large fetch.min.bytes it is easy to think "no response until that much piles up". What really happens is once fetch.max.wait.ms passes, you get whatever is there, because when the wait ends DelayedFetch.onComplete() reads the log again and calls the callback with that result (section 4). In case b) of example 1 below, only 212 bytes exist but the consumer asks with fetch.min.bytes=1048576; after waiting 3 seconds it receives those 212 bytes.
3. Reading from disk — from an offset to a slice of a file
read() finds the partition and calls Partition.fetchRecords() (lines 1838–1844), which checks that this broker is the leader and that the leader epoch matches, then goes to readRecords(). Here are the start and end of readRecords().
    // Note we use the log end offset prior to the read. This ensures that any appends following
    // the fetch do not prevent a follower from coming into sync.
    val initialHighWatermark = localLog.highWatermark
    // ... (logStartOffset, logEndOffset, lastStableOffset the same way) ...

    // ... (check for a diverging log using the follower's lastFetchedEpoch — post 9) ...

    val fetchedData = localLog.read(
      fetchOffset,
      maxBytes,
      fetchIsolation,
      minOneMessage
    )
core/src/main/scala/kafka/cluster/Partition.scala lines 1379–1424, abridged
The HW and LEO are noted down before the read. These values become the HighWatermark and LogStartOffset fields of the response. The comment's reason is about followers (records appended during the read must not stop a follower from joining the ISR), which we revisit in post 9. Despite its name, localLog here is a UnifiedLog. We now go down the four layers from post 7 (UnifiedLog → LocalLog → LogSegments → LogSegment) one by one.
UnifiedLog.read(): decide how far the read may go
    public FetchDataInfo read(long startOffset,
                              int maxLength,
                              FetchIsolation isolation,
                              boolean minOneMessage) throws IOException {
        checkLogStartOffset(startOffset);
        LogOffsetMetadata maxOffsetMetadata = switch (isolation) {
            case LOG_END -> localLog.logEndOffsetMetadata();
            case HIGH_WATERMARK -> fetchHighWatermarkMetadata();
            case TXN_COMMITTED -> fetchLastStableOffsetMetadata();
        };
        return localLog.read(startOffset, maxLength, minOneMessage, maxOffsetMetadata, isolation == FetchIsolation.TXN_COMMITTED);
    }
storage/src/main/java/org/apache/kafka/storage/internals/log/UnifiedLog.java lines 1663–1674
The picture from section 1 becomes code here. Depending on FetchIsolation, one of LEO, HW or LSO becomes "the end". That end is not a single number but a LogOffsetMetadata, which holds three values together: the offset, the base offset of the segment it is in, and the byte position inside that segment file (LogOffsetMetadata.java lines 27–47). Because the byte position is known, "up to just before the HW" turns directly into "up to byte N of the file".
LocalLog.read(): pick the segment and pass the position it may cut at
                    LogOffsetMetadata endOffsetMetadata = nextOffsetMetadata;
                    long endOffset = endOffsetMetadata.messageOffset;
                    Optional<LogSegment> segmentOpt = segments.floorSegment(startOffset);
                    // return error on attempt to read beyond the log end offset
                    if (startOffset > endOffset || segmentOpt.isEmpty()) {
                        throw new OffsetOutOfRangeException("Received request for offset " + startOffset + " for partition " + topicPartition + ", " +
                                "but we only have log segments upto " + endOffset + ".");
                    }
                    if (startOffset == maxOffsetMetadata.messageOffset) return emptyFetchDataInfo(maxOffsetMetadata, includeAbortedTxns);
                    if (startOffset > maxOffsetMetadata.messageOffset) return emptyFetchDataInfo(convertToOffsetMetadataOrThrow(startOffset), includeAbortedTxns);

                    // ... (comments omitted) ...
                    FetchDataInfo fetchDataInfo = null;
                    while (fetchDataInfo == null && segmentOpt.isPresent()) {
                        LogSegment segment = segmentOpt.get();
                        long baseOffset = segment.baseOffset();

                        // ... (comments omitted) ...
                        Optional<Long> maxPositionOpt;
                        if (segment.baseOffset() < maxOffsetMetadata.segmentBaseOffset)
                            maxPositionOpt = Optional.of((long) segment.size());
                        else if (segment.baseOffset() == maxOffsetMetadata.segmentBaseOffset && !maxOffsetMetadata.messageOffsetOnly())
                            maxPositionOpt = Optional.of((long) maxOffsetMetadata.relativePositionInSegment);
                        else
                            maxPositionOpt = Optional.empty();

                        fetchDataInfo = segment.read(startOffset, maxLength, maxPositionOpt, minOneMessage);
                        if (fetchDataInfo != null) {
                            // ... (for read_committed, attach the list of aborted transactions — post 12) ...
                        } else {
                            segmentOpt = segments.higherSegment(baseOffset);
                        }
                    }
storage/src/main/java/org/apache/kafka/storage/internals/log/LocalLog.java lines 479–518, abridged
floorSegment(startOffset)picks the last segment whose base offset is ≤startOffset(theConcurrentSkipListMaplookup from post 7).- If
startOffsetlies beyond the end of the log, it is anOffsetOutOfRangeException— the error the consumer'sauto.offset.resetdeals with. - If
startOffsetequals "the end" (the HW, say), it returns an empty result without reading. This is the state of a consumer that has caught up, and it makesbytesReadable0 in section 2, which leads to long polling. - For each segment it sets
maxPositionOpt, "the last byte position this segment may be read to". If "the end" is in a later segment, this segment may be read to its end (segment.size()); if it is in this segment, up to that byte position. - If this segment has no records at or after
startOffset(null), it moves on to the next segment (higherSegment).
LogSegment.read(): find the position through the index and cut a range of the file
        LogOffsetPosition startOffsetAndSize = translateOffset(startOffset);

        // if the start position is already off the end of the log, return null
        if (startOffsetAndSize == null)
            return null;

        int startPosition = startOffsetAndSize.position;
        LogOffsetMetadata offsetMetadata = new LogOffsetMetadata(startOffsetAndSize.offset, this.baseOffset, startPosition);

        int adjustedMaxSize = maxSize;
        if (minOneMessage)
            adjustedMaxSize = Math.max(maxSize, startOffsetAndSize.size);

        // return empty records in the fetch-data-info when:
        // 1. adjustedMaxSize is 0 (or)
        // 2. maxPosition to read is unavailable
        if (adjustedMaxSize == 0 || maxPositionOpt.isEmpty())
            return new FetchDataInfo(offsetMetadata, MemoryRecords.EMPTY);

        // calculate the length of the message set to read based on whether or not they gave us a maxOffset
        int fetchSize = Math.min((int) (maxPositionOpt.get() - startPosition), adjustedMaxSize);

        return new FetchDataInfo(offsetMetadata, log.slice(startPosition, fetchSize),
            adjustedMaxSize < startOffsetAndSize.size, Optional.empty());
storage/src/main/java/org/apache/kafka/storage/internals/log/LogSegment.java lines 439–462
translateOffset() is the method we read closely in post 7. It binary-searches the offset index (.index) for the file position of "the largest entry ≤ the offset we want", then scans only batch headers from there to find the start position and size of the batch that contains startOffset (lines 398–401). The index is sparse — one entry every 4 KB — which is why the scan is needed.
Then comes the most important line in this post: log.slice(startPosition, fetchSize). log is this segment's FileRecords, and slice() looks like this.
    @Override
    public FileRecords slice(int position, int size) {
        int availableBytes = availableBytes(position, size);
        int startPosition = this.start + position;

        return new FileRecords(file, channel, startPosition, startPosition + availableBytes, transferFailureHandler);
    }
clients/src/main/java/org/apache/kafka/common/record/internal/FileRecords.java lines 174–180
All it does is create a new FileRecords that holds the same file and the same FileChannel with different start and end positions. It does not read any record bytes from the file. The output of the read path, FetchDataInfo, is "offset metadata + an object pointing at a range of a file". Actually moving the bytes is put off until a network thread does it in section 6.
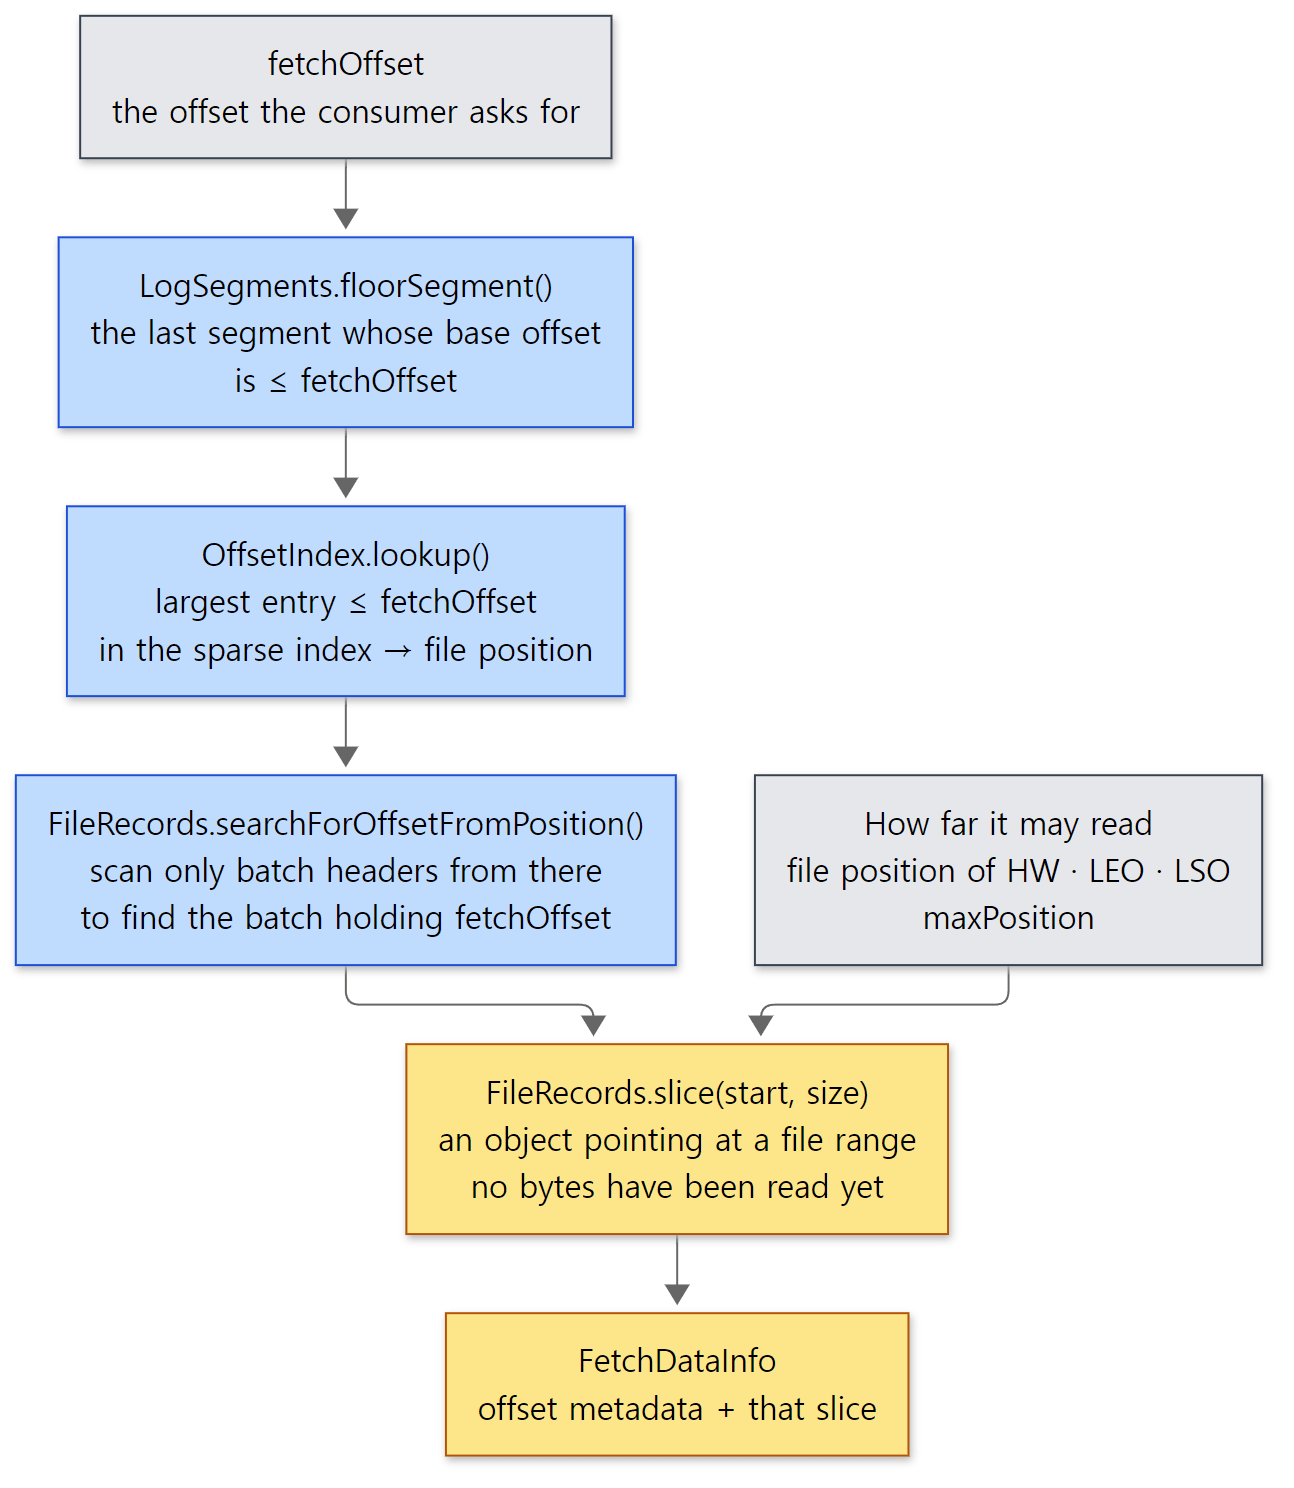 All the read path does inside the broker is decide "from where to where". The yellow boxes hold positions, not bytes.
If you saw in post 10 of the nginx series how the static file handler writes only "from byte N to byte M of the file" into a buffer without reading the content, this is the same idea. In Kafka the "static file" is a segment, and the range is chosen by offset.
Easy to get wrong: "up to just before the HW" is cut by byte position, not by record
Since fetchSize = min(maxPosition - startPosition, adjustedMaxSize), the cut happens at a byte position. maxPosition is the start of the batch containing the HW, so the batches before the HW go in whole. But when the cut comes from adjustedMaxSize (the partition limit), the last batch can go into the response cut in the middle. The consumer drops that cut batch and gets it again from its start on the next Fetch (the client's ByteBufferLogInputStream.nextBatch() does not hand out a batch when fewer bytes remain than its size, lines 41–46). Conversely, if the first batch is larger than the limit, minOneMessage lets it in whole (lines 449–450); and if even that is off and the first batch gets cut, firstEntryIncomplete becomes true and ReplicaManager replaces the result with an empty one (lines 1782–1785).
One more thing: if maxOffsetMetadata knows only the offset and not the byte position (messageOffsetOnly()), maxPositionOpt is empty and lines 455–456 return an empty result. It is a safety catch against reading past the HW without knowing where it is. Normally this does not happen: UnifiedLog.fetchHighWatermarkMetadata() first converts an offset-only HW into a file position (UnifiedLog.java lines 607–619), and the offset alone remains only when that conversion fails (when the offset is not in a local segment).
4. Long polling — DelayedFetch and the purgatory
When fetchMessages() in section 2 finds too little data, it takes the else branch.
        val delayedFetch = new DelayedFetch(
          params,
          fetchPartitionStatus,
          this,
          quota,
          (fetchPartitionData: util.LinkedHashMap[TopicIdPartition, FetchPartitionData]) => responseCallback(fetchPartitionData.asScala.toSeq)
        )

        // create a list of (topic, partition) pairs to use as keys for this delayed fetch operation
        val delayedFetchKeys = fetchPartitionStatus.keySet()
          .stream()
          .map(new TopicPartitionOperationKey(_))
          .toList()

        // try to complete the request immediately, otherwise put it into the purgatory;
        // this is because while the delayed fetch operation is being created, new requests
        // may arrive and hence make this operation completable.
        delayedFetchPurgatory.tryCompleteElseWatch(delayedFetch, delayedFetchKeys)
core/src/main/scala/kafka/server/ReplicaManager.scala lines 1728–1745
Reading Scala —
(x: Type) => expris a lambda. The_innew TopicPartitionOperationKey(_)is a placeholder for the incoming argument, short for the lambdatp => new TopicPartitionOperationKey(tp).
A DelayedFetch is an object holding "this request's read conditions (params), the start position per partition (fetchPartitionStatus), and the callback to call when done". It is registered in the purgatory under one key per partition (TopicPartitionOperationKey). handleFetchRequest() ends here, and the request-handler thread goes back to the queue for the next request — step 6 in the picture. This is where post 4's "a request-handler thread is not held until the response goes out" happens.
DelayedFetch: may I finish now?
DelayedFetch extends DelayedOperation and passes its time limit with super(params.maxWaitMs) in the constructor (DelayedFetch.java line 86). A subclass fills in two methods: tryComplete(), which checks "may I finish now", and onComplete(), "what to do when finishing". In 4.4.0 this class was a Scala file in core (kafka/server/DelayedFetch.scala); on trunk it was moved to Java by commit 013710cc3a (2026-09-09, "Move DelayedFetch to server module"). The completion cases (A–H) are the same in both. Here is the core of tryComplete().
                    LogOffsetMetadata endOffset = switch (params.isolation) {
                        case LOG_END -> offsetSnapshot.logEndOffset();
                        case HIGH_WATERMARK -> offsetSnapshot.highWatermark();
                        case TXN_COMMITTED -> offsetSnapshot.lastStableOffset();
                    };

                    // ... (3 comment lines cut — if the offsets are equal, go straight to the Case G check) ...
                    if (fetchOffset.messageOffset > endOffset.messageOffset) {
                        // ... (Case F: the start lies beyond the current end — a truncated leader — finish now) ...
                    } else if (fetchOffset.messageOffset < endOffset.messageOffset) {
                        if (fetchOffset.onOlderSegment(endOffset)) {
                            // ... (Case F: reading an older segment that has already been rolled past — finish now) ...
                        } else if (fetchOffset.onSameSegment(endOffset)) {
                            // We take the partition fetch size as upper bound when accumulating the bytes
                            // (skip if a throttled partition).
                            int bytesAvailable = Math.min(endOffset.positionDiff(fetchOffset), fetchStatus.fetchInfo().maxBytes);
                            if (!params.isFromFollower() || !ReplicaManagerAdapter.shouldLeaderThrottle(quota, partition, params.replicaId)) {
                                accumulatedSize += bytesAvailable;
                            }
                        }
                    }
                    // ... (Case H: diverging epoch, and Case A–E in the catch blocks: no longer the leader, etc.) ...

        // Case G
        if (accumulatedSize >= params.minBytes) {
            return forceComplete();
        }
        return false;
server/src/main/java/org/apache/kafka/server/purgatory/DelayedFetch.java lines 129–220, abridged
Section 3's LogOffsetMetadata is used again here. For each partition, if "the position at the first read" (fetchOffset) and "the current end" (endOffset) are in the same segment, the difference between the two byte positions (positionDiff) is exactly the number of new bytes. It counts "how much has piled up" with one subtraction, without reading the log again. When the total reaches minBytes (Case G), it calls forceComplete(). The comment at the top lists eight completion cases, A–H (lines 101–113). Besides bytes piling up, cases like "no longer the leader" or "the partition is gone" finish right away, since waiting would be pointless.
forceComplete() lives in DelayedOperation: whoever takes the lock and flips completed to true — only once — calls onComplete() (DelayedOperation.java lines 60–81). Even if several threads try to finish it at the same time, the response goes out once. DelayedFetch.onComplete() is three statements long: it gathers the per-partition request info again and calls responseCallback.accept(replicaManager.readFromLogByPurgatory(params, fetchInfos, quota)) (DelayedFetch.java lines 235–245).
It does not keep the result of the first read. When finishing, readFromLogByPurgatory() reads the log again from scratch (section 3's path once more) and passes that result to the callback, so records written during the wait are included. That is step 8 in the picture.
Who wakes it up: checkAndComplete() and the timer
The purgatory's tryCompleteElseWatch() first tries tryComplete() once; if that fails, it adds the operation to the watcher list of every key, tries tryComplete() once more, and if it still cannot finish, puts it on the timer.
        if (operation.safeTryCompleteOrElse(() -> {
            watchKeys.forEach(key -> {
                if (!operation.isCompleted())
                    watchForOperation(key, operation);
            });
            if (!watchKeys.isEmpty())
                estimatedTotalOperations.incrementAndGet();
        })) {
            return true;
        }

        // if it cannot be completed by now and hence is watched, add to the timeout queue also
        if (!operation.isCompleted()) {
            if (timerEnabled)
                timeoutTimer.add(operation);
            // ...
        }
        return false;
The reason for checking once more after registering is in the comment (lines 127–131). If a record arrives between the check and the registration, that signal could be missed; checking again after registering guarantees that "every later signal goes through the watcher list".
There are two wakers.
One: another request changed the partition's state. When a Produce writes records, ReplicaManager queues this task at the end.
    actionQueue.add {
      () => appendResults.foreach { case (topicIdPartition, result) =>
        val requestKey = new TopicPartitionOperationKey(topicIdPartition.topicPartition)
        result.logAppendSummary.leaderHwChange match {
          case LeaderHwChange.INCREASED =>
            // some delayed operations may be unblocked after HW changed
            delayedProducePurgatory.checkAndComplete(requestKey)
            delayedFetchPurgatory.checkAndComplete(requestKey)
            delayedDeleteRecordsPurgatory.checkAndComplete(requestKey)
            // ... (the share group purgatory) ...
          case LeaderHwChange.SAME =>
            // probably unblock some follower fetch requests since log end offset has been updated
            delayedFetchPurgatory.checkAndComplete(requestKey)
          case LeaderHwChange.NONE =>
          // nothing
        }
      }
    }
core/src/main/scala/kafka/server/ReplicaManager.scala lines 857–875, abridged
Reading Scala —
x match { case A => ... case B => ... }is much like a Javaswitchexpression.actionQueue.add { () => ... }passes a lambda with no arguments.
If the HW went up (INCREASED), even consumers' Fetches are woken; if only the LEO grew (SAME), it wakes them for followers' Fetches, as the comment says. Both are the same delayedFetchPurgatory.checkAndComplete(key), which calls tryComplete() again on every DelayedFetch registered under that key. The task is only queued here; it runs from replicaManager.tryCompleteActions() in the finally of KafkaApis.handle() (lines 262–266). The comment gives the reason as "to avoid conflicting locking". So, usually, the request-handler thread that handled the Produce, after finishing that request, also builds and sends the response for the waiting Fetch (the queue is shared by the request-handler threads, so another thread that reaches its finally first may run it instead). When a follower takes in replicated data and moves the HW, ReplicaFetcherThread calls the same checkAndComplete() too (ReplicaManager.scala lines 319–321, post 9).
Two: the time is up. A purgatory gets a SystemTimer when it is created (new SystemTimer(purgatoryName), line 70), and that timer runs expired tasks on a single thread named executor- + the name, created with Executors.newFixedThreadPool(1, …) (SystemTimer.java lines 54–55). The clock is driven by the ExpirationReaper-<broker id>-<name> thread, which calls advanceClock(200L) over and over; it returns at once if a bucket has expired, otherwise after waiting at most 200 ms (DelayedOperationPurgatory.java lines 409–417). An expired task goes DelayedOperation.run() → forceComplete() → onComplete() on the executor-Fetch thread (DelayedOperation.java lines 145–149). The Fetch purgatory is named "Fetch" (ReplicaManager.scala lines 188–191), so the threads are ExpirationReaper-1-Fetch and executor-Fetch. ExpirationReaper-1-Fetch is a thread we only saw by name in post 2's thread table.
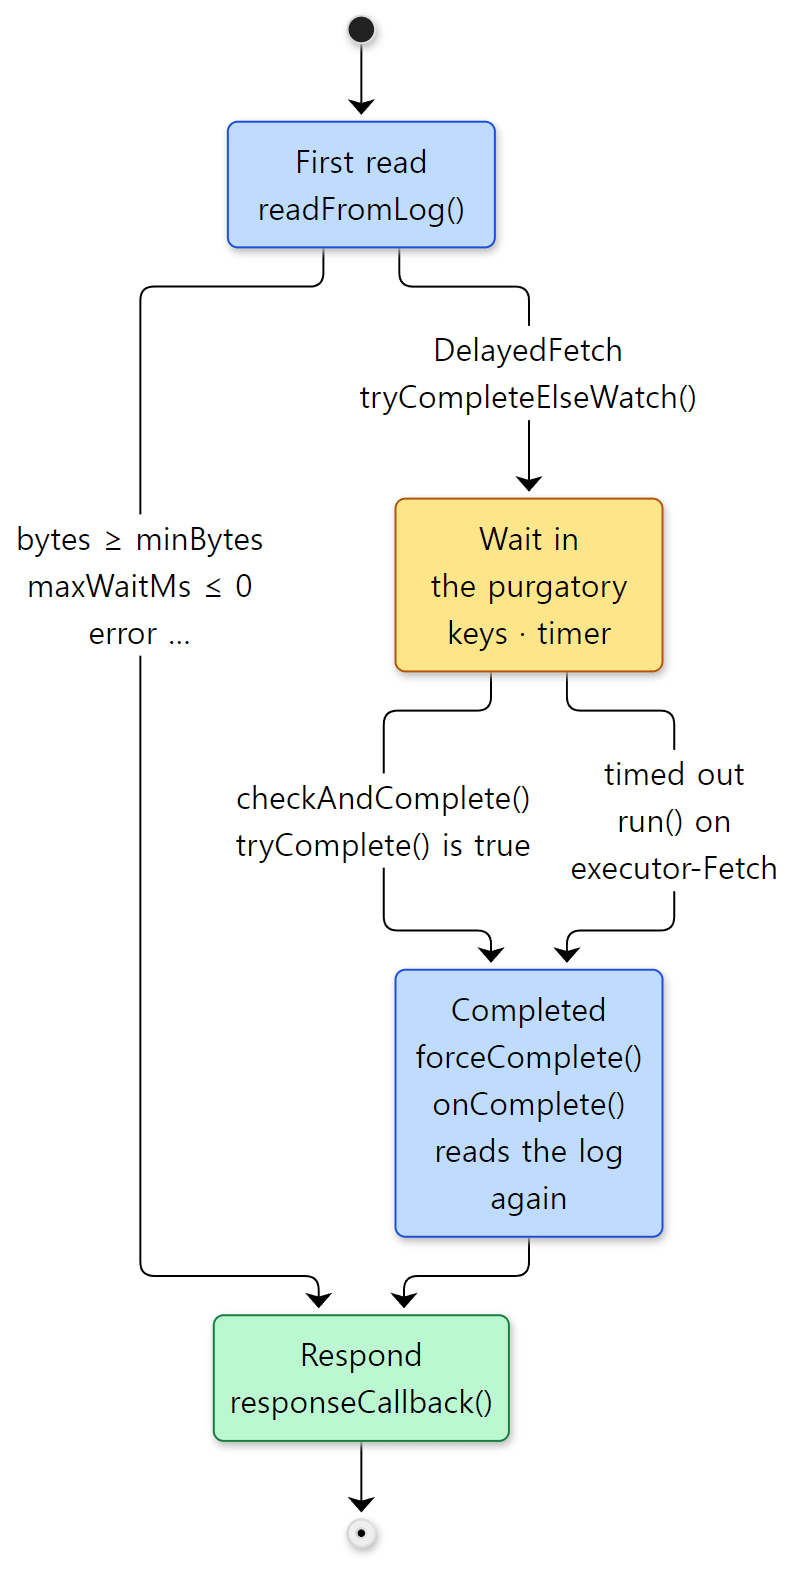 There are two doors into Completed, but what happens after (read the log again, call the callback) is the same. That is why it answers with "whatever is there" even on timeout.
Example 1: changing fetch.min.bytes and fetch.max.wait.ms
I checked this behavior with a stopwatch. This example was run in a Docker container (Eclipse Temurin JDK 25) with Kafka 4.5.0-SNAPSHOT built as-is from the reference commit (ab1e816411). The example folder is ex/u08-fetch. It starts one server (broker + controller) with the request logger (kafka.request.logger) turned on, puts 10 records (offsets 0–9) into a one-partition topic u08, and measures "time until the first records arrive" with consumers that differ only in their settings.
// An example written for this post (not part of Kafka's source)
// Vary the consumer's fetch.min.bytes / fetch.max.wait.ms and measure how long it takes to get the first records.
// ... (usage comments and imports cut) ...
public class LongPoll {
    public static void main(String[] args) throws Exception {
        // ... (args: topic, start offset, fetch.min.bytes, fetch.max.wait.ms, client.id, [produceAfterMs]) ...
        props.put(ConsumerConfig.FETCH_MIN_BYTES_CONFIG, minBytes);    // "fetch.min.bytes"
        props.put(ConsumerConfig.FETCH_MAX_WAIT_MS_CONFIG, maxWait);   // "fetch.max.wait.ms"

        TopicPartition tp = new TopicPartition(topic, 0);
        try (KafkaConsumer<String, String> consumer = new KafkaConsumer<>(props)) {
            // assign() without group.id — only Fetch requests, no group coordinator involved
            consumer.assign(List.of(tp));
            consumer.seek(tp, startOffset);
            consumer.partitionsFor(topic);                             // fetch metadata up front (to keep it out of the timing)

            long start = System.nanoTime();
            // ... (if produceAfterMs is given, another thread sends one record after that long) ...
            int got = 0;
            while (got == 0 && (System.nanoTime() - start) < 20_000_000_000L) {
                ConsumerRecords<String, String> recs = consumer.poll(Duration.ofMillis(200));
                got = recs.count();
            }
            // ... (print the elapsed time and the number of records received) ...
        }
    }

    // ... (produceOne(): send one record and wait for the response) ...
}
[Abridged from the example ex/u08-fetch/LongPoll.java]
I ran three cases: a) data is there, default settings (fetch.min.bytes=1); b) data is there but below fetch.min.bytes=1048576 (1 MiB), with fetch.max.wait.ms=3000; c) waiting at the end of the log (offset 10) while, after 1.5 seconds, another thread creates a producer and sends one record. Each request-log (kafka-request.log) line is a long JSON object, so only the needed fields are extracted. Clock times, elapsed times (ms) and session ids differ on every run (two more runs gave 512 ms and 872 ms for a), 3153 ms and 3293 ms for b)). In c), the [producer] line and the u08-c: line are printed a few ms apart, so their order can flip between runs.
topic u08: 10 records at offsets 0..9
=== 1. long polling: how long until the first records arrive
--- a) data is there, fetch.min.bytes=1 (default)
u08-a: fetch.min.bytes=1 fetch.max.wait.ms=500 -> 10 records after 263 ms
--- b) data is there but less than fetch.min.bytes=1048576, fetch.max.wait.ms=3000
u08-b: fetch.min.bytes=1048576 fetch.max.wait.ms=3000 -> 10 records after 3235 ms
--- c) at the end of the log (offset 10), fetch.max.wait.ms=10000, a producer sends 1 record after 1500 ms
u08-c: fetch.min.bytes=1 fetch.max.wait.ms=10000 -> 1 records after 2174 ms
  [producer] sent 1 record at 2192 ms
--- kafka-request.log: Fetch requests of b) and c) (fields shortened)
04:43:10,390 u08-b corr=4 req[maxWaitMs=3000 minBytes=1048576 sessionId=0 epoch=0 topics=1 fetchOffset=0] resp[sessionId=371989317 partitions=1 hw=10 bytes=212] total=3005.598 local=1.933 remote=3002.72 send=0.453
04:43:13,486 u08-b corr=6 req[maxWaitMs=3000 minBytes=1048576 sessionId=371989317 epoch=1 topics=1 fetchOffset=10] resp[sessionId=371989317 partitions=0 hw=- bytes=-] total=3004.113 local=1.052 remote=3002.316 send=0.313
04:43:13,488 u08-b corr=7 req[maxWaitMs=3000 minBytes=1048576 sessionId=371989317 epoch=-1 topics=0 fetchOffset=-] resp[sessionId=0 partitions=0 hw=- bytes=-] total=0.992 local=0.543 remote=0.0 send=0.207
04:43:27,920 u08-c corr=4 req[maxWaitMs=10000 minBytes=1 sessionId=0 epoch=0 topics=1 fetchOffset=10] resp[sessionId=545400081 partitions=1 hw=11 bytes=72] total=1856.662 local=1.051 remote=1854.681 send=0.463
04:43:38,045 u08-c corr=6 req[maxWaitMs=10000 minBytes=1 sessionId=545400081 epoch=1 topics=1 fetchOffset=11] resp[sessionId=545400081 partitions=0 hw=- bytes=-] total=10003.258 local=0.969 remote=10001.505 send=0.327
04:43:38,047 u08-c corr=7 req[maxWaitMs=10000 minBytes=1 sessionId=545400081 epoch=-1 topics=0 fetchOffset=-] resp[sessionId=0 partitions=0 hw=- bytes=-] total=1.205 local=0.646 remote=0.0 send=0.306
We met the request log's time fields in post 4. local is how long a request-handler thread held the request, and remote is how long it then waited until the response was built (Request.java lines 336–337). Reading it:
- a) 10 records in 263 ms. Data was there and
minBytes=1, so condition 3) offetchMessages()held and it answered right away. - b) The first Fetch (corr=4) used a request-handler thread for only
local=1.9msand waitedremote=3002msin the purgatory. 212 bytes could not satisfy Case G (1 MiB), soexecutor-Fetchfinished it on timeout. Even so, the response carriesbytes=212— section 2's "you get whatever is there". - c) The first Fetch waited at the end of the log and finished after
remote=1854ms, carryinghw=11andbytes=72(a one-record batch). It did not wait the full 10 seconds: the Produce raised the HW, andcheckAndComplete()woke thisDelayedFetch. The consumer got it at 2174 ms, while the producer thread printed "sent" at 2192 ms — later, because the producer prints only after getting the Produce response and closing the producer (two more runs gave 1803 ms and 1833 ms, and then, in the other order, 1996 ms and 1988 ms — either way the two times sit within a few tens of ms of each other). So the response to the waiting Fetch went out as soon as the Produce was handled (according to the source, the request-handler thread that handled the Produce wakes it at the end ofhandle()).
We come back to corr=6 and 7 of each client in section 5.
Example 2: what is inside the broker while a Fetch waits
This is the second part of the same run.sh. A consumer waits in the background at the end of the log (offset 11) with fetch.min.bytes=1048576 and fetch.max.wait.ms=15000. After confirming that its Fetch is in the purgatory (JMX is turned on in the broker JVM with jcmd … ManagementAgent.start, and kafka-jmx.sh reads the purgatory gauges), jstack shows the request-handler threads' state at that moment and the purgatory's threads. The final stopped line is cut. Clock times, elapsed times and session ids differ on every run; the gauge values and the thread states and counts were the same in all three runs.
=== 2. while a Fetch waits in the purgatory
kafka.server:type=DelayedOperationPurgatory,name=NumDelayedOperations,delayedOperation=Fetch:Value=1
kafka.server:type=DelayedOperationPurgatory,name=PurgatorySize,delayedOperation=Fetch:Value=2
--- request-handler threads right now (state)
     16    java.lang.Thread.State: TIMED_WAITING (parking)
--- threads that belong to the Fetch purgatory
"ExpirationReaper-1-Fetch"
"executor-Fetch"
u08-d: fetch.min.bytes=1048576 fetch.max.wait.ms=15000 -> 0 records after 20053 ms
04:44:16,300 u08-d corr=4 req[maxWaitMs=15000 minBytes=1048576 sessionId=0 epoch=0 topics=1 fetchOffset=11] resp[sessionId=904435016 partitions=1 hw=11 bytes=0] total=15012.666 local=0.923 remote=15010.602 send=0.334
NumDelayedOperations=1: one task on the timer, i.e. the one waiting Fetch (numDelayed()istimeoutTimer.size(), lines 217–219).- While that Fetch waited 15 seconds, all 16 request-handler threads were
TIMED_WAITING (parking)— idle on an empty request queue. There are 16 because in combined mode the broker and the controller each build their own pool of 8 (see "Easy to get wrong" in post 2). What waits is not a thread but aDelayedFetchobject. - The response 15 seconds later has
local=0.9ms,remote=15010ms,bytes=0. No data ever arrived, so it is empty.
Thanks to this design, even thousands of consumers long-polling with fetch.max.wait.ms=500 release the request-handler threads (num.io.threads, default 8) almost at once. In a model where one thread held one request to the end, you would need as many threads as waiting consumers. If you saw in post 5 of the Tomcat series how a keep-alive connection lets go of its worker thread between requests, this applies the same idea to one request's "wait for a response".
Easy to get wrong
PurgatorySizeandNumDelayedOperationsdiffer. Above,PurgatorySize=2while only one Fetch is waiting.PurgatorySizecounts entries in the watcher lists (watched()), and as the comment says, "some of its watched entries may still be in the watch lists even when it has been completed", so it can be larger than reality (DelayedOperationPurgatory.javalines 201–206).ExpirationReaperpurges completed entries in bulk once their number exceedsfetch.purgatory.purge.interval.requests(default 1000) (lines 392–403). A task woken bycheckAndComplete()is removed from the list on the spot, but a task that finished by timing out stays there until the nextcheckAndComplete()on that key or the bulk purge (Watchers.tryCompleteWatched(), lines 333–352). The leftover seems to be corr=6 of case c) in example 1, which waited the full 10 seconds and timed out. To see "how many are waiting right now", look atNumDelayedOperations.- A waiting Fetch blocks the next request on its connection. In example 1, corr=6 of c) waited 10 seconds, and corr=7, sent when the consumer closed, finished only 2 ms after corr=6 (
04:43:38,045→04:43:38,047). corr=7's owntotalis 1.2 ms, so the broker received corr=7 only after corr=6's response had gone out. Because of post 4's "one request at a time per connection (mute)" rule, requests on the same connection queue up until the earlier one leaves the purgatory. That is why closing a consumer can take up tofetch.max.wait.ms.
5. Incremental fetch sessions — exchanging only changed partitions
Imagine one consumer reading hundreds of partitions. Every Fetch would list hundreds of partition names (or topic ids), offsets and limits, and every response would return hundreds of HWs and log start offsets — even for partitions with no data. Most of those values are the same as last time. An incremental fetch session (KIP-227) is the mechanism for "leave out what is the same as last time".
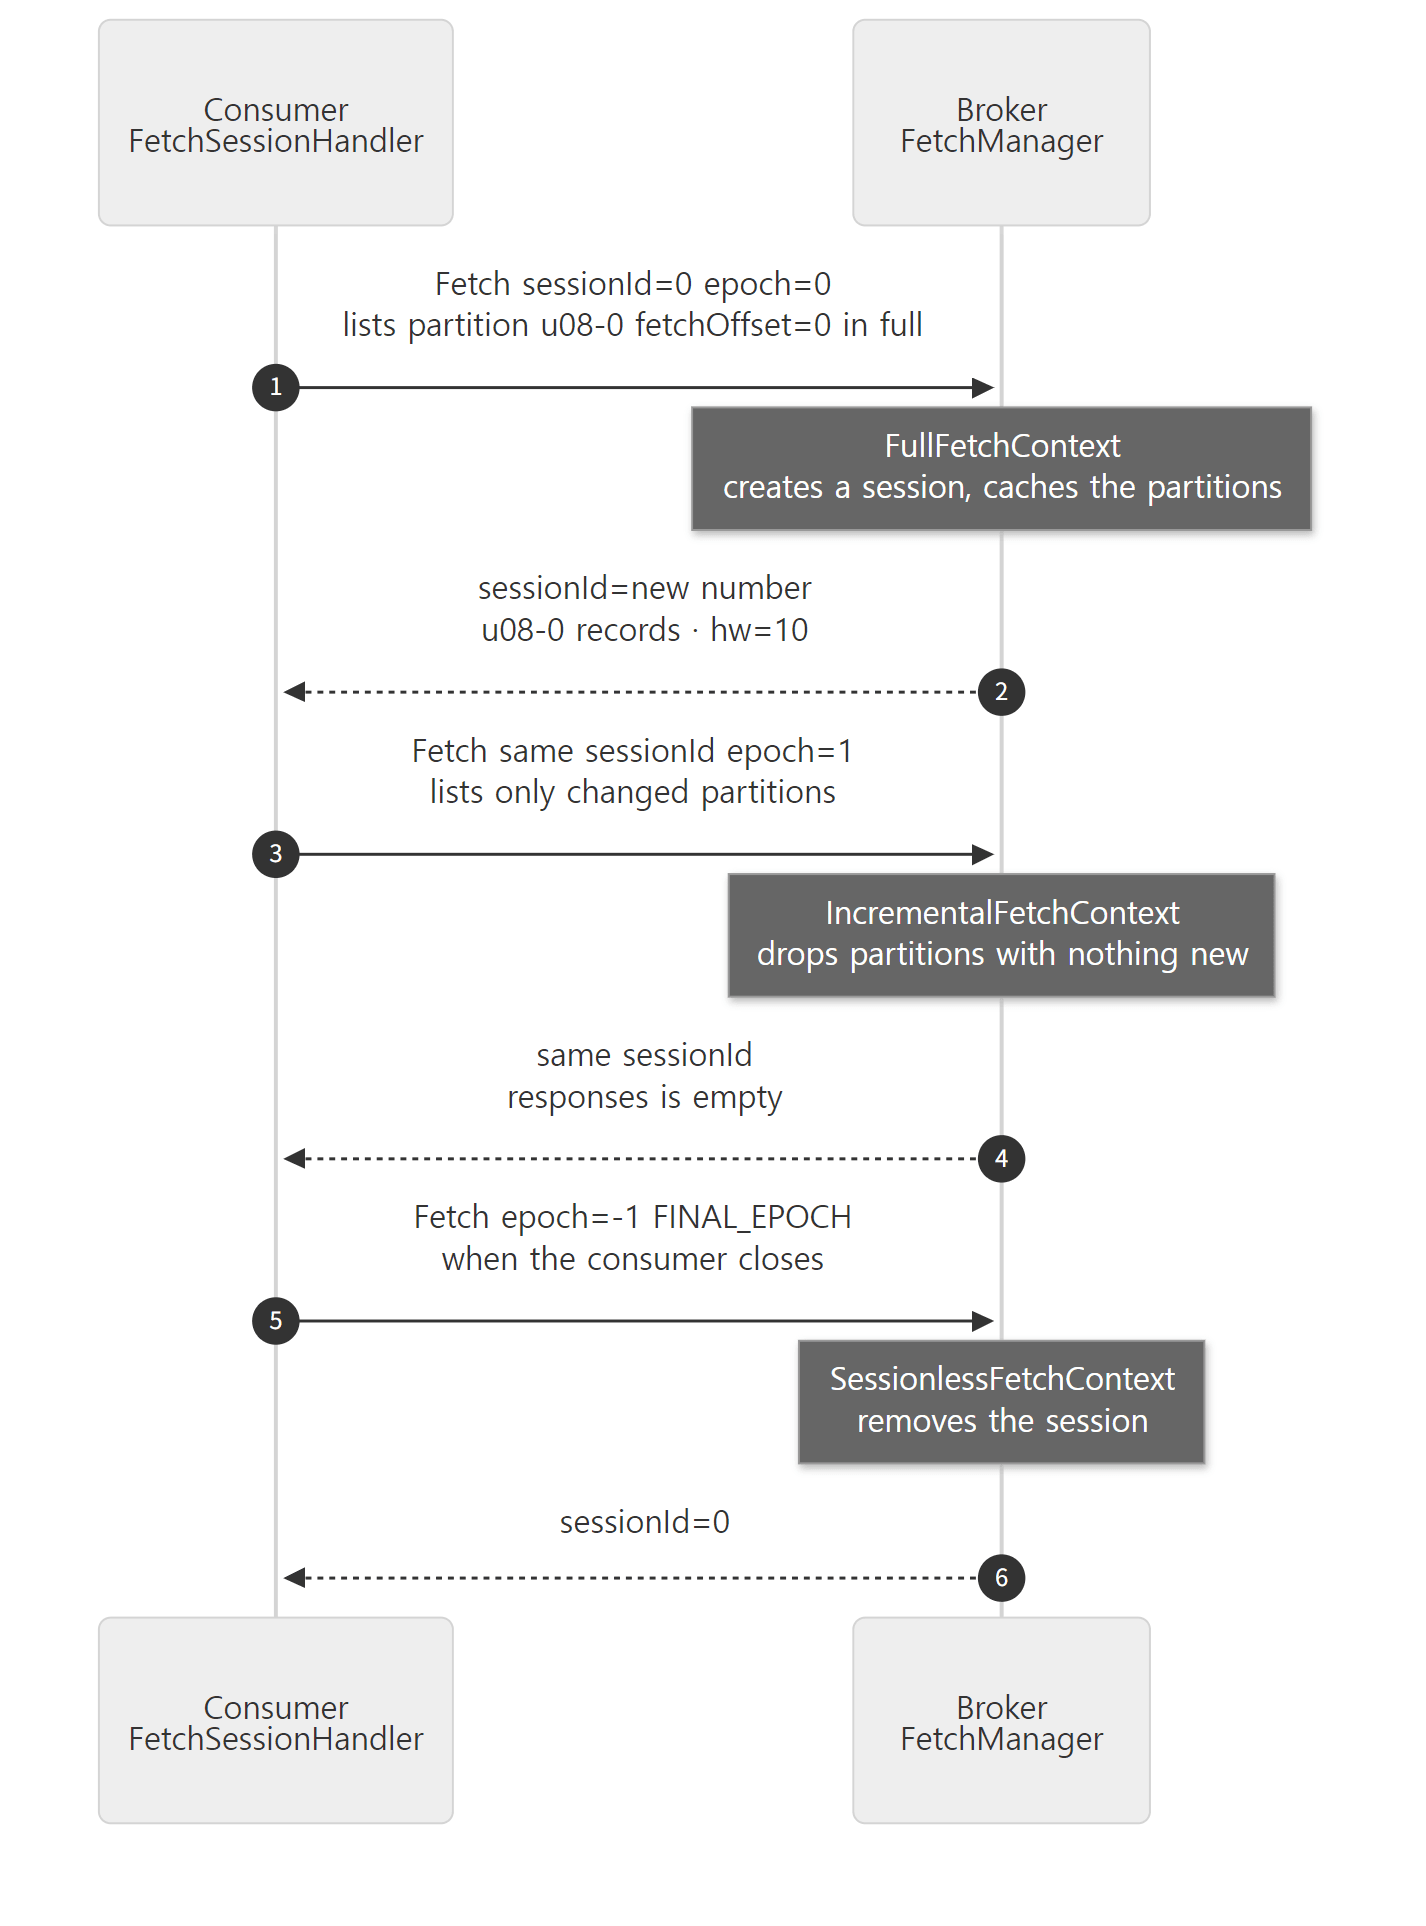 Case b) of example 1 is exactly this conversation (corr=4 → 6 → 7).
FetchManager.newContext(): three branches based on the request's session fields
The fetchManager.newContext(...) call that handleFetchRequest() makes first (section 2) does this.
        if (reqMetadata.isFull()) {
            // ... (if the request names a session id, that session is removed) ...
            FetchContext fetchContext;
            if (reqMetadata.epoch() == FINAL_EPOCH) {
                // If the epoch is FINAL_EPOCH, don't try to create a new session.
                suffix = " Will not try to create a new session.";
                fetchContext = new SessionlessFetchContext(fetchData);
            } else
                fetchContext = new FullFetchContext(time, cache, fetchData, reqVersion >= 13, isFollower);
            // ... (debug log) ...
        } else {
            // ... (look up the session: FETCH_SESSION_ID_NOT_FOUND if missing, INVALID_FETCH_SESSION_EPOCH if the epoch differs) ...
                            List<List<TopicIdPartition>> lists = session.update(fetchData, toForget);
                            // ... (if the session becomes empty, remove it and use SessionlessFetchContext) ...
                                cacheShard.touch(session, time.milliseconds());
                                session.setEpoch(FetchMetadata.nextEpoch(session.epoch()));
                                // ... (debug log) ...
                                return new IncrementalFetchContext(reqMetadata, session, topicNames);
server/src/main/java/org/apache/kafka/server/FetchManager.java lines 64–125, abridged
isFull() is true when the epoch is 0 (INITIAL_EPOCH) or -1 (FINAL_EPOCH) (FetchMetadata.java lines 91–93). So there are three branches.
| Request's (sessionId, epoch) | Context | What it does |
|---|---|---|
| (0, 0) — first | FullFetchContext |
Takes the full partition list; when building the response it creates a new session and returns its id |
| (N, 1 or more) — continuing | IncrementalFetchContext |
Applies only this request's additions, changes and removals to the list remembered in the session |
| (N, -1) — closing | SessionlessFetchContext |
Removes the session and does not create a new one |
session.update(fetchData, toForget) changes only "what the request lists". Partitions not in the request stay in the session with their previous offsets, and foreachPartition() reads them all again. So a consumer needs to list only the partitions whose offset changed.
What gets dropped from the response: maybeUpdateResponseData()
On the response side, the session remembers the HW and log start offset it last sent for each partition, and leaves a partition out when nothing changed.
        boolean maybeUpdateResponseData(FetchResponseData.PartitionData respData, boolean updateResponseData) {
            // Check the response data.
            boolean mustRespond = false;
            if (FetchResponse.recordsSize(respData) > 0) {
                // Partitions with new data are always included in the response.
                mustRespond = true;
            }
            if (highWatermark != respData.highWatermark()) {
                mustRespond = true;
                if (updateResponseData)
                    highWatermark = respData.highWatermark();
            }
            if (localLogStartOffset != respData.logStartOffset()) {
                mustRespond = true;
                if (updateResponseData)
                    localLogStartOffset = respData.logStartOffset();
            }
            // ... (always included if there is a preferred replica, an error or a diverging epoch) ...
            return mustRespond;
        }
server/src/main/java/org/apache/kafka/server/FetchSession.java lines 336–371, abridged
IncrementalFetchContext.updateAndGenerateResponseData() runs each partition through this method to shrink the response list (FetchContext.java lines 346–367).
Reading case b) of example 1 against this table:
- corr=4: a full request with
sessionId=0 epoch=0. The response carriedsessionId=371989317— a session was created. - corr=6: the same session id with
epoch=1. It listed the partition (topics=1) because its offset changed from 0 to 10. The response after a 3-second wait haspartitions=0, an emptyresponses: no new records and the HW still 10, somaybeUpdateResponseData()dropped it. - corr=7:
epoch=-1, sent when the consumer closed. The session was removed and the answer hassessionId=0.
Easy to get wrong: there are only 1,000 session slots per broker
Sessions are not free: the broker keeps each session's partition list in memory. The number of slots is the broker setting max.incremental.fetch.session.cache.slots (default 1000), and its description says "FetchSessionCache is sharded into 8 shards and the limit is equally divided among all shards" (ServerConfigs.java lines 110–112). Sessions created by followers are marked "privileged" (FetchSession.java lines 66–67) and are evicted less readily than consumer sessions. With more consumers than that, some never get a session and send a full request every time. Everything still works, the requests are just bigger, so it is easy to miss. The detailed eviction rules are in FetchSessionCacheShard.java; this post does not follow them.
6. Zero-copy — how a slice of a file reaches the socket
In section 3 the read path produced "a FileRecords pointing at a range of a file". Let's follow how that object becomes a response and reaches the socket.
The response carries the file slice as is
processResponseCallback from section 2 fills in each partition's response fields (HW, log start offset …), and puts the read result as is into the records field (.setRecords(data.records), KafkaApis.scala line 655). data.records is section 3's FileRecords slice. In the response schema this field has a special type, "records" (FetchResponse.json line 115).
In FetchResponseData.java, generated from that schema at build time (generated at the reference commit; it is not in the repository), this field is counted separately when sizing the message.
_size.addZeroCopyBytes(records.sizeInBytes());
Line 1327 of the generated clients/…/common/message/FetchResponseData.java (generated at the reference commit)
When writing, it calls _writable.writeRecords(records); (line 1217 of the same file). These bytes are counted separately as "zero-copy bytes" so that no buffer is allocated for them when the response buffer is built. SendBuilder, which turns the response into bytes, does that.
    @Override
    public void writeRecords(BaseRecords records) {
        if (records instanceof MemoryRecords) {
            flushPendingBuffer();
            addBuffer(((MemoryRecords) records).buffer());
        } else if (records instanceof UnalignedMemoryRecords) {
            flushPendingBuffer();
            addBuffer(((UnalignedMemoryRecords) records).buffer());
        } else {
            flushPendingSend();
            addSend(records.toSend());
        }
    }
clients/src/main/java/org/apache/kafka/common/protocol/SendBuilder.java lines 136–148
SendBuilder writes the response header and the other fields into one buffer of size messageSize.sizeExcludingZeroCopy() + 4 (line 220). If the records field is an in-memory MemoryRecords, its buffer is appended to the list; for anything else, like FileRecords, records.toSend() slots in a "thing to send later" (a Send). FileRecords.toSend() is new DefaultRecordsSend<>(this) (AbstractRecords.java lines 68–71). So a Fetch response becomes a MultiRecordsSend chaining "header bytes buffer → file slice → next partition's header buffer → file slice …" (lines 173–181).
This Send is built by request.buildResponseSend(response) inside requestChannel.sendResponse() (RequestChannel.scala lines 91–100), on whichever thread called the callback (a request-handler thread, or section 4's executor-Fetch). That thread still does not read the file; it just puts the Send on the response queue.
The network thread: from writeTo() to transferTo()
The Processor takes the response off the response queue, registers it as something to write on that connection with selector.send(new NetworkSend(connectionId, responseSend)) (SocketServer.scala line 966), and when the socket becomes writable it writes via Selector.write() → KafkaChannel.write() → send.writeTo(transportLayer) (post 4's "the way back for a response"). When the file slice's turn comes, RecordsSend.writeTo() → DefaultRecordsSend.writeTo() → records().writeTo(channel, ...) reaches FileRecords (RecordsSend.java lines 46–61, DefaultRecordsSend.java lines 33–35).
    @Override
    public int writeTo(TransferableChannel destChannel, int offset, int length) throws IOException {
        int oldSize = sizeInBytes();
        long position = start + offset;
        int count = Math.min(length, oldSize - offset);
        try {
            long newSize = Math.min(channel.size(), end) - start;
            if (newSize < oldSize)
                throw new KafkaException(String.format(
                        "Size of FileRecords %s has been truncated during write: old size %d, new size %d",
                        file.getAbsolutePath(), oldSize, newSize));
            // safe to cast to int since `count` is an int
            return (int) destChannel.transferFrom(channel, position, count);
        } catch (IOException e) {
            // ... (comments omitted) ...
            if (transferFailureHandler != null && !(e instanceof ClosedChannelException))
                transferFailureHandler.onTransferFailure(this, position, count, e);
            throw e;
        }
    }
clients/src/main/java/org/apache/kafka/common/record/internal/FileRecords.java lines 328–349, abridged
destChannel is the connection's transport layer (TransportLayer). The javadoc of the TransferableChannel interface it implements sums up the design in one sentence: "delegate to FileChannel.transferTo, but unwrap the destination channel, if possible, in order to benefit from zero copy. This is required because the fast path of transferTo is only executed if the destination buffer inherits from an internal JDK class" (TransferableChannel.java lines 37–42). The plaintext (PLAINTEXT) listener's implementation does exactly that.
    @Override
    public long transferFrom(FileChannel fileChannel, long position, long count) throws IOException {
        return fileChannel.transferTo(position, count, socketChannel);
    }
clients/src/main/java/org/apache/kafka/common/network/PlaintextTransportLayer.java lines 212–215
From the segment file's FileChannel, to the connection's raw SocketChannel, count bytes starting at position. Kafka's "zero-copy" is this one line. The record bytes never land on the JVM heap or in a direct buffer; the operating system moves them from the file to the socket. The JDK on Linux is known to handle this with the sendfile system call, but that is JDK-side code and not something this series verified in source. Example 3 below verifies only that "the JVM did not read the file bytes".
httpd does the same with file buckets and EnableSendfile (post 12 of the httpd series), and nginx with sendfile on; (post 10 of the nginx series). Static-file web servers and Kafka reach for the same tool for the same reason: the bytes to send are exactly as they sit on disk, so there is nothing to change. The design from post 6, "the broker writes the producer's batch almost as is", pays off here. Because the batch format on disk equals the record format in the response, the broker hands over the file range whole without ever opening the batches.
Why not under TLS: SslTransportLayer.transferFrom()
The TLS (SSL) listener's transport layer implements the same method very differently.
    /**
     * Transfers bytes from `fileChannel` by reading them into a buffer and writing them to this channel, since
     * they have to be encrypted.
     * ... (exception notes omitted) ...
     */
    @Override
    public long transferFrom(FileChannel fileChannel, long position, long count) throws IOException {
        // ... (state checks, flush any pending ciphertext first) ...
        if (fileChannelBuffer == null) {
            // ... (why 32k — efficient disk reads vs. memory per connection) ...
            int transferSize = 32768;
            // Allocate a direct buffer to avoid one heap to heap buffer copy. SSLEngine copies the source
            // buffer (fileChannelBuffer) to the destination buffer (netWriteBuffer) and then encrypts in-place.
            // FileChannel.read() to a heap buffer requires a copy from a direct buffer to a heap buffer, which is not
            // useful here.
            fileChannelBuffer = ByteBuffer.allocateDirect(transferSize);
            // ... (put the buffer into the empty state) ...
        }

        int totalBytesWritten = 0;
        long pos = position;
        while (totalBytesWritten < totalBytesToWrite) {
            if (!fileChannelBuffer.hasRemaining()) {
                // ... (clear the buffer and decide how much to read) ...
                    bytesRead = fileChannel.read(fileChannelBuffer, pos);
                // ...
            }
            int networkBytesWritten = write(fileChannelBuffer);
            // ... (handle partial writes) ...
        }
        return totalBytesWritten;
    }
clients/src/main/java/org/apache/kafka/common/network/SslTransportLayer.java lines 1002–1069, abridged
The first comment gives the reason: "by reading them into a buffer and writing them to this channel, since they have to be encrypted." What goes out through the socket must be the encrypted form of the file's bytes, not the bytes themselves. Encryption is done by the SSLEngine inside the JVM, so the bytes have to come up into the JVM. It therefore does FileChannel.read() into a 32 KB direct buffer, and write() encrypts with sslEngine.wrap() into netWriteBuffer and sends it with socketChannel.write() (lines 710–742; flush() at lines 247–250). Note also the comment on why a direct buffer is used: reading into a heap buffer would add one more direct-to-heap copy. If zero-copy is impossible, at least save one copy.
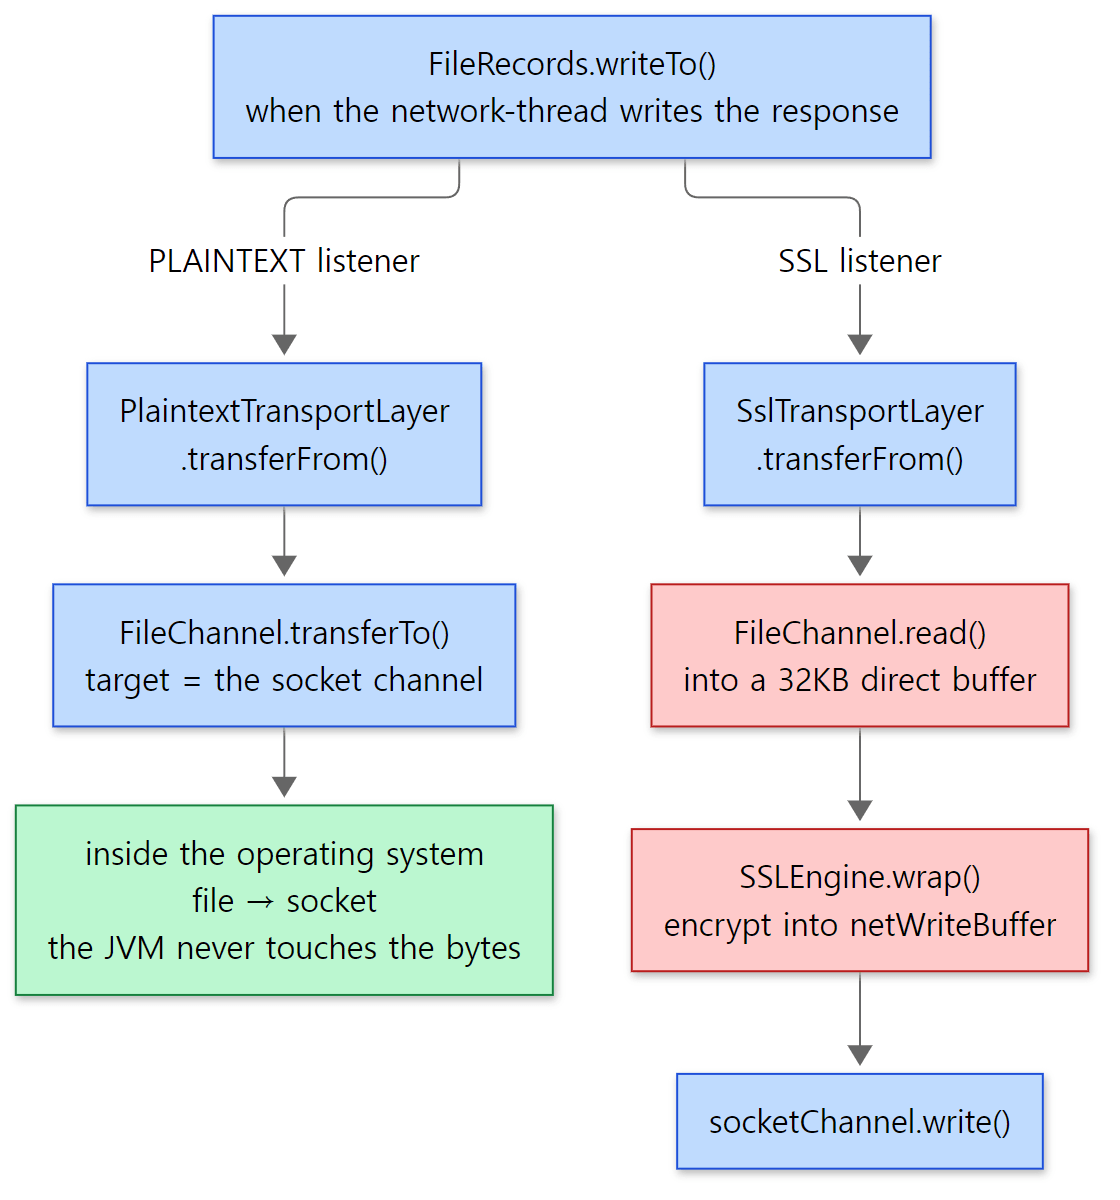 The two red boxes are the work TLS adds: the record bytes come up into the JVM, get read and get encrypted.
Example 3: does the JVM read the segment file? PLAINTEXT vs. SSL
The example folder is ex/u08-zerocopy (same environment as example 1). On a server with an extra SSL listener (9095, self-signed certificate), it creates a topic of about 48 MB and has one consumer read it from start to end over PLAINTEXT (9092) and another over SSL. During each read, JFR (Java Flight Recorder) in the broker JVM records every file-read event (jdk.FileRead) and socket-write event (jdk.SocketWrite), and only those on network threads are counted; file reads count only reads of the topic's segment (big-0/….log). JFR was started with event settings like jcmd <pid> JFR.start 'jdk.FileRead#threshold=0ms' 'jdk.FileRead#throttle=off' …, and the consumers were kafka-consumer-perf-test.sh.
=== 1. one topic, about 48 MB of records
50500078 /tmp/kafka/1/data/big-0/00000000000000000000.log
=== 2. PLAINTEXT listener (9092)
consumed 50000 records, 47.6837 MB
plain network threads: segment reads (jdk.FileRead) 0 events, 0.0 MB / socket writes (jdk.SocketWrite) 277 events, 0.0 MB
=== 3. SSL listener (9095)
consumed 50000 records, 47.6837 MB
ssl network threads: segment reads (jdk.FileRead) 1545 events, 48.3 MB / socket writes (jdk.SocketWrite) 4947 events, 48.4 MB
--- one segment read on an SSL network thread (JDK frames removed)
    path = "/tmp/kafka/1/data/big-0/00000000000000000000.log"
    bytesRead = 32.0 kB
    endOfFile = false
    eventThread = "data-plane-kafka-network-thread-1-SSL-SSL-4" (javaThreadId = 82)
    stackTrace = [
      org.apache.kafka.common.network.SslTransportLayer.transferFrom(FileChannel, long, long) line: 1049
      org.apache.kafka.common.record.internal.FileRecords.writeTo(TransferableChannel, int, int) line: 340
      org.apache.kafka.common.record.internal.DefaultRecordsSend.writeTo(TransferableChannel, int, int) line: 34
      org.apache.kafka.common.record.internal.RecordsSend.writeTo(TransferableChannel) line: 50
      org.apache.kafka.common.record.internal.MultiRecordsSend.writeTo(TransferableChannel) line: 89
      org.apache.kafka.common.network.NetworkSend.writeTo(TransferableChannel) line: 45
      org.apache.kafka.common.network.KafkaChannel.write() line: 440
      ... (Selector.write → attemptWrite → pollSelectionKeys → poll → Processor.poll, cut for this post) ...
      kafka.network.Processor.run() line: 879
    ]
  }
The five middle frames of the stack and the final stopped line are cut for this post. The file size and the event counts vary a little from run to run (another run gave a 50,499,505-byte segment, 169 socket writes for PLAINTEXT, and 1,547 segment reads / 48.3 MB and 4,800 socket writes / 48.5 MB for SSL). The shape — zero segment reads for PLAINTEXT, about 48 MB in 32 kB reads for SSL — was the same.
- PLAINTEXT: while 47.7 MB went out, network threads read the segment 0 times, and the 277 socket-write events add up to 0.0 MB (zero at one decimal place). Those 277 are small writes adding up to less than 0.05 MB (they look like response header buffers and small responses to other requests, but I did not check them one by one). The record bytes never went through any Java read or write that JFR can see, because
transferTo()moved them inside the operating system. - SSL: sending the same amount took 1,545 segment reads totalling 48.3 MB,
32.0 kBat a time — the source'stransferSize = 32768. In the stack,SslTransportLayer.transferFrom(…) line: 1049is thefileChannel.read(fileChannelBuffer, pos)line in the excerpt above, andFileRecords.writeTo(…) line: 340is thedestChannel.transferFrom(...)line.kafka.network.Processor.run()at the bottom shows that all of this happens on a network thread.
The amount of record bytes the broker JVM handled split into 0 and 48 MB between the two listeners. That is a big part of why CPU usage goes up when you turn on TLS (this example did not measure CPU time itself).
Easy to get wrong
- It is not true that "the broker never reads records". After the offset index, section 3's
translateOffset()scans batch headers withsearchForOffsetFromPosition()(FileRecords.javalines 395–425). What it does not read is the record bodies. And, as post 6 showed, the broker validates batches on the write path. Zero-copy is only about the "response body" of the read path. - Disk errors surface on a network thread. The bytes are actually read inside
transferTo(), so if the disk is failing, the error appears as anIOExceptionin the network thread'swriteTo(), not on a request-handler thread. But a dropped socket is the sameIOException. To tell them apart, this commit attaches atransferFailureHandlerto the slicesLocalLog.read()returns. The comment states the situation plainly: "The records of a fetch are read from the segment only when they are written to the network, after this log has returned them, so an IOException from that read cannot be caught here" (LocalLog.javalines 531–541). When a transfer fails, the handler re-reads that range on a scheduler thread, and if the read fails too, it takes the log directory offline. This mechanism is not in 4.4.0. It came to trunk with commit0d82450b0a(2026-10-20, KAFKA-16304 "Offline the log directory on a disk error in the zero-copy Fetch path"); 4.4.0'sFileRecords.writeTo()just callstransferFrom()with notry/catch(checked withgit show 4.4.0:…). - A response being sent finishes even if the file is deleted. A
FileRecordsslice holds the segment'sFileChannel. When retention deletes a segment, it first only renames it to.deletedand removes it afterfile.delete.delay.ms(default 60 seconds) precisely because reads like this may already be pointing at the segment ("deletion in two steps" in post 7).
What this post leaves out
Things that live on the read path but that this post did not follow:
- Reading from a nearby replica (follower fetching): when a consumer sets
client.rack, the leader names a follower in the same rack as the "preferred replica".ReplicaManager.findPreferredReadReplica(), lines 1813–1834 ofread(), settingreplica.selector.class. - Reading from tiered storage:
DelayedRemoteFetchandprocessRemoteFetches()read offsets that are no longer local from remote storage (ReplicaManager.scalalines 1605–1657),handleOffsetOutOfRangeError()(from line 1913). - Quotas and throttling: lines 701–721 of
processResponseCallback,quotas.fetchandquotas.leader(the follower replication quota). - Transaction isolation:
LocalLog.addAbortedTransactions(), which attaches the list of aborted transactions forread_committed— post 12. - The follower side:
updateFollowerFetchState()inPartition.fetchRecords()(lines 1316–1325), diverging epochs (divergingEpoch) and truncation — post 9. - Where the consumer receives:
AbstractFetch.handleFetchSuccess()(line 151) andFetchCollector.collectFetch()(line 91), which unpack the response batches into the recordspoll()returns, and the consumer-side session handlingFetchSessionHandler— post 11. - Others: share groups'
ShareFetch(KafkaApis.handleShareFetchRequest(), line 3280 — left out of this series) and theTimingWheelunder the purgatory timer (server-common/…/util/timer/TimingWheel.java).
Summary
| Concept | One-line summary |
|---|---|
| Fetch request | Consumers (ReplicaId=-1) and followers (broker id) use the same request; who sent it decides whether HW, LSO or LEO is the end it may read to (FetchIsolation.of()) |
fetchMessages() |
Reads once; if the bytes reach minBytes (or maxWaitMs ≤ 0, an error, …) it calls back at once, otherwise it registers a DelayedFetch in the purgatory |
minOneMessage |
The first partition that yields data gets its whole first batch even beyond the limit — so a big batch can't get stuck |
| Output of the read path | LogSegment.read() finds the position via the index and FileRecords.slice() points at just a file range; no bytes are read yet |
DelayedFetch |
Counts new bytes as the difference of byte positions and calls forceComplete() when enough; on completion it reads the log again and answers with "whatever is there" |
| Wakers | The request that wrote records calls checkAndComplete() (in the finally of KafkaApis.handle()); on timeout, the executor-Fetch thread |
| While waiting | The request-handler threads are free; what waits is an object. But the next request on the same connection queues up (mute) |
| Incremental fetch session | (0,0) full → (N,1…) changes only → (N,-1) close. Responses include only partitions whose records, HW or log start offset changed |
| Zero-copy | The response carries the FileRecords as is, and a network thread sends it with PlaintextTransportLayer.transferFrom() → FileChannel.transferTo() |
| TLS | SslTransportLayer.transferFrom() reads into a 32 KB direct buffer, encrypts and writes; not zero-copy |
What's next
This post looked at Fetch mostly through a consumer's eyes. When a follower broker sends the same Fetch, there is one more story. The leader looks at the follower's Fetch offset to record "how far has this follower caught up", uses that to grow and shrink the ISR, and moves the high watermark. When the HW moves, the checkAndComplete() we saw in section 4 wakes waiting consumer Fetches and acks=all Produces. Post 9: Replication — The ISR, the High Watermark and the Wait Behind acks=all follows ReplicaFetcherThread and Partition.maybeIncrementLeaderHW().
- Post 4: The Broker's Network Layer — Acceptors, Processors and Request Handlers — how a response returns to the Processor, and mute
- Post 6: How the Broker Accepts Records — The Record Batch Format and the Produce Path — why the batch on disk is the batch in the response
- Post 7: Log Storage — Segments, Indexes, Retention and Compaction —
translateOffset()and the sparse index - Post 11: The Consumer and the Group Coordinator — Inside poll() and Rebalancing — the consumer side that unpacks the response into records
- nginx post 10: Filters and Static Files — How a Response Flows Out —
sendfilechecked with strace - httpd post 12: Handlers and Static Files — How a File Becomes a Response — how a file bucket reaches the socket via sendfile, mmap or read